Contour
| Syntax | |||||||
struct PolygonData **Contour(void *zbuffer,int type, int wdt,int hgt,int cnum, void *cval,int smooth,int cflag,int rflag, int bflag); | |||||||
| Header | |||||||
| general/contour.h | |||||||
| Library | |||||||
| contour | |||||||
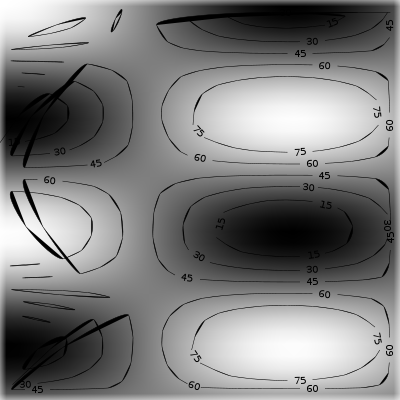
| Description | |||||||
The The argument zbuffer is a pointer to the two dimensional array that contains the data to trace, the type of the array is given by the argument type. Possible values of type are:
The arguments wdt and hgt define the width and height of the data set. The array pointed to by zbuffer can represent data in a cartesian, polar, or any other co-ordinate system. The tracing algorithm uses the topological relationship that adjacent entries in the array will also be adjacent in the actual co-ordinate system. The data should be arranged in row-major form with the first wdt bytes of the array corresponding to the first row of data. The argument cnum defines the number of contours to be traced and the array pointed to by cval lists the corresponding contour levels. The argument smooth is a smoothing factor that determines the frequency at which points are marked along a contour line. Smaller values will yield a more accurate contour but can start to show affects due to the size of the data grid. If the argument oflag is non-zero then contour lines that do not close are ignored. For polar and other co-ordinate systems, the edges of the array do not represent a boundary and when a contour intersects an edge the tracing algorithm should continue on the opposite side of the array. Whether the algorithm continues searching at the intersection of the array edges is determined by the value of the argument rflag; (0) terminates at all edges, (1) continues at the left and right edges, (2) continues at the top and bottom edges, and (3) continues at all edges. The argument bflag determines whether the contour algorithm records points traced along the edges of the array or ignores them. If the value of bflag is zero then tracing is performed. If the first bit (corresponding to 1) is set, then points along the left edge of the array are ignored. If the second bit (corresponding to 2) is set, then points along the right edge of the array are ignored. If the third bit (corresponding to 4) is set, then points along the top edge of the array are ignored. If the fourth bit (corresponding to 4) is set, then points along the bottom edge of the array are ignored. | |||||||
| Returns | |||||||
Returns a pointer to an array of polygons that define the contours. On error, a NULL pointer is returned. | |||||||
| Errors | |||||||
On error, a NULL pointer is returned. | |||||||
| Example | |||||||
|