--help | print the help message and exit. |
--version | print the RST version number and exit. |
-cf cfname | read command line options from the file cfname. |
-sd yyyymmdd | plot starting from the date yyyymmdd. |
-st hr:mn | plot starting from the time hr:mn. |
-ed yyyymmdd | stop plotting at the date yyyymmdd. |
-et hr:mn | stop plotting at the time hr:mn. |
-ex hr:mn | plot an interval whose extent is hr:mn. |
-name name | title the image name, for those formats that support image naming. |
-wdt width | set the width of the plot to width. |
-hgt height | set the height of the plot to height. |
-bgcol rrggbb | set the background color to rrggbb, specified as the hexadecimal value for the 24-bit red,green and blue component color. |
-pbgcol rrggbb | set the panel background color to rrggbb, specified as the hexadecimal value for the 24-bit red,green and blue component color. |
-grdcol rrggbb | set the color of grid to rrggbb, specified as the hexadecimal value for the 24-bit red,green and blue component color. |
-txtcol rrggbb | set the color of text to rrggbb, specified as the hexadecimal value for the 24-bit red,green and blue component color. |
-gscol rrggbb | set the color of ground scatter to rrggbb, specified as the hexadecimal value for the 24-bit red,green and blue component color. |
-pkey pkeyname | load the power colorkey from the file pkeyname. |
-pkey_path pkey_path | load the power colorkey from the custom path pkey_path. |
-vkey vkeyname | load the velocity colorkey from the file vkeyname. |
-vkey_path vkey_path | load the velocity colorkey from the custom path vkey_path. |
-wkey wkeyname | load the spectral width colorkey from the file wkeyname. |
-wkey_path wkey_path | load the spectral width colorkey from the custom path wkey_path. |
-phikey phikeyname | load the phi0 colorkey from the file phikeyname. |
-phikey_path phikey_path | load the phi0 colorkey from the custom path phikey_path. |
-ekey ekeyname | load the elevation angle colorkey from the file ekeyname. |
-ekey_path ekey_path | load the elevation angle colorkey from the custom path ekey_path. |
-vekey vekeyname | load the velocity error colorkey from the file vekeyname. |
-vekey_path vekey_path | load the velocity error colorkey from the custom path vekey_path. |
-wekey wekeyname | load the spectral width error colorkey from the file wekeyname. |
-wekey_path wekey_path | load the spectral width error colorkey from the custom path wekey_path. |
-p0key p0keyname | load the lag0 power colorkey from the file p0keyname. |
-p0key_path p0key_path | load the lag0 power colorkey from the custom path p0key_path. |
-fkey fkeyname | load the frequency colorkey from the file fkeyname. |
-fkey_path fkey_path | load the frequency colorkey from the custom path fkey_path. |
-nkey nkeyname | load the noise colorkey from the file nkeyname. |
-nkey_path nkey_path | load the noise colorkey from the custom path nkey_path. |
-fontname fontname | plot any labels using the font fontname. |
-fontsize fontsize | set the font size to fontsize points. |
-tfontname tfontname | plot the title using the font tfontname. |
-tfontsize tfontsize | set the title font size to tfontsize points. |
-tmajor hr:mn | set the interval of the Time axis major tick mark to be hr:mn. |
-tminor hr:mn | set the interval of the Time axis minor tick mark to be hr:mn. |
-b bmnum | plot beam number bmnum, a value of -1 plots all beams. |
-c channel | for stereo mode data, plot channel channel, if omitted then both channels are plotted. |
-cp cpid | plot beams that contain the program identifier cpid only. |
-scan scan | plot beams that have a value for the scan flag of scan. |
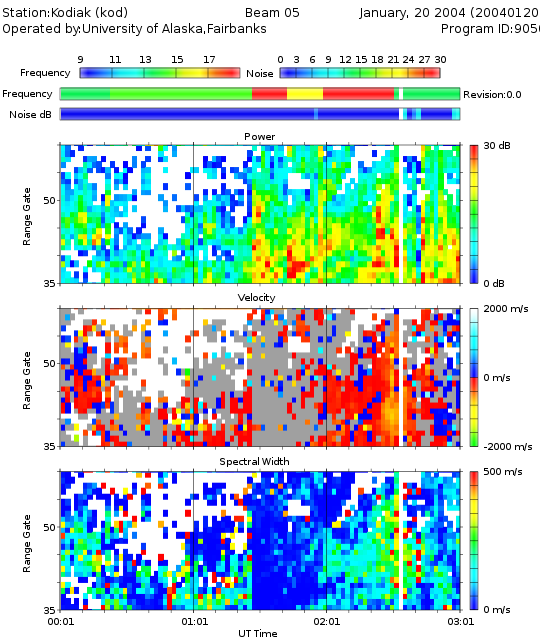
-a | plot power, velocity, and spectral width. |
-p | plot power. |
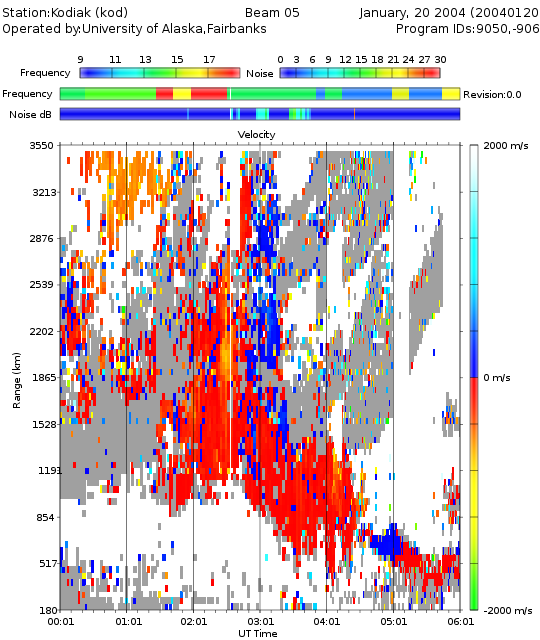
-v | plot velocity. |
-w | plot spectral width. |
-phi | plot phi0. |
-e | plot elevation angle. |
-ve | plot velocity error. |
-we | plot spectral width error. |
-p0 | plot lag0 power. |
-pmin pmin | set the minimum value of the power scale to pmin. |
-pmax pmax | set the maximum value of the power scale to pmax. |
-vmin vmin | set the minimum value of the velocity scale to vmin. |
-vmax vmax | set the maximum value of the velocity scale to vmax. |
-wmin wmin | set the minimum value of the spectral width scale to wmin. |
-wmax wmax | set the maximum value of the spectral width scale to wmax. |
-phimin phimin | set the minimum value of the phi0 scale to phimin. |
-phimax phimax | set the maximum value of the phi0 scale to phimax. |
-emin emin | set the minimum value of the elevation angle scale to emin. |
-emax emax | set the maximum value of the elevation angle scale to emax. |
-vemin vemin | set the minimum value of the velocity error scale to vemin. |
-vemax vemax | set the maximum value of the velocity error scale to vemax. |
-wemin wemin | set the minimum value of the spectral width error scale to wemin. |
-wemax wemax | set the maximum value of the spectral width error scale to wemax. |
-p0min p0min | set the minimum value of the lag0 power scale to p0min. |
-p0max p0max | set the maximum value of the lag0 power scale to p0max. |
-gs | color ground scatter. |
-gm | mask out ground scatter. |
-ns | ignore non-scan data (data with a scan flag of -1). |
-km | plot in terms of distance in kilometers. |
-frang frang | force the distance to the first range to be frang kilometers. |
-erang erang | force the distance to the last range to be erang kilometers. |
-rsep rsep | force the range separation to be rsep kilometers. |
-lr | limit the ranges plotted. |
-srng start | set the first range to plot to be start. |
-erng end | set the last range to plot to be end. |
-geo | plot in terms of geographic latitude. |
-mag | plot in terms of geomagnetic latitude. |
-old_aacgm | user older AACGM rather than AACGM-v2 for magnetic coordinates. |
-latmin latmin | force the lower latitude limit to be latmin degrees. |
-latmax latmax | force the upper latitude limit to be latmax degrees. |
-ymajor ymajor | set the interval of the Y-axis major tick mark to be ymajor. |
-yminor yminor | set the interval of the Y-axis minor tick mark to be yminor. |
-ytick ytick | set the number Y-axis tick marks ytick. |
-fn expr | apply the mathematic expression expr to the data before it is plotted. |
fitacfname | filename of the fitacf format file to plot. |
inxname | filename of the index file. |
-old | file is in the fit format. |
fitname | filename of the fit format file to plot. |
-cfit | file is in the cfit format. |
cfitname | filename of the cfit format file to plot. |
-smr | file is in the smr format. |
-fbeam fbeam | assume that the first beam in a scan in the summary file is fbeam. |
smrname | filename of the smr format file to plot. |
-snd | file is in the snd format. |
sndname | filename of the snd format file to plot. |
-png | produce a Portable Network Graphics (PNG) image as the output. |
-ps | produce a PostScript plot as the output. |
-xp xoff | set the X offset of the PostScript plot to xoff. |
-yp xoff | set the Y offset of the PostScript plot to yoff. |
-ppm | produce a Portable PixMap (PPM) image as the output. |
-ppmx | produce an extended Portable PixMap (PPMX) image as the output. |
-xml | produce an XML image representation as the output. |
-x | plot the data on an X-terminal. |
-display display | connect to the xterminal named display. |
-xoff xoff | open the window, xoff pixels from the left edge of the screen. |
-yoff yoff | open the window ypad pixels from the top edge of the screen. |
-chisham | use the Chisham virtual height model. |