--help | print the help message and exit. |
--version | print the RST version number and exit. |
-cf cfname | read command line options from the file cfname. |
-old | the input file is in grd format. |
-def | plot using some sensible default options so that the user will see something plotted. |
-sd yyyymmdd | plot starting from the date yyyymmdd. |
-st hr:mn | plot starting from the time hr:mn. |
-ed yyyymmdd | stop plotting at the date yyyymmdd. |
-et hr:mn | stop plotting at the time hr:mn. |
-ex hr:mn | plot an interval whose extent is hr:mn. |
-tn | generate filenames of the form hrmn.sc.xxx. |
-dn | generate filenames of the form yyyymmdd.hrmn.sc.xxx. |
-mn | use the time of the midpoint of each record to generate the filename. |
-wdt width | set the width of the plot to width. |
-hgt height | set the height of the plot to height. |
-padpad | set the padding around the edge of the plot to pad. |
-sf scale | set the scale factor (magnification) to scale. The default scale factor is 1. |
-ortho | use an orthographic projection. |
-lat lat | center the plot on the latitude given by lat. |
-lon lon | center the plot on the longitude given by lon. |
-latmin latmin | adjust the scale factor so that the lowest visible latitude is latmin. Applies when the stereographic projection is used. |
-mag | use magnetic coordinates. |
-old_aacgm | use older AACGM rather than default AACGM-v2 for magnetic coordinates. |
-rotate | rotate the plot so that the local noon is at the top of the plot. |
-flip | flip the direction of the X-axis. |
-square | force the use of a square bounding box around the plot. |
-coast | plot coastlines. |
-fcoast | plot filled coastlines. |
-bnd | plot state boundaries. |
-grd | plot a grid. |
-grdlat grdlat | set the latitude spacing of the grid to grdlat degrees. |
-grdlon grdlon | set the longitude spacing of the grid to grdlon degrees. |
-igrd | plot the inverse grid, if the plot is in geographic coordinates, a geomagnetic grid is plotted, if the plot is in geomagnetic coordinates, a geographic grid is plotted. |
-igrdlat igrdlat | set the latitude spacing of the inverse grid to grdlat degrees. |
-igrdlon igrdlon | set the longitude spacing of the inverse grid to grdlon degrees. |
-igrdontop | plot the inverse grid on top. |
-grdontop | plot the grid on top. |
-tmk | plot a clock-dial grid showing the time. |
-fov | plot the radar field of view. |
-ffov | plot the filled radar field of view. |
-gfov | only plot fields of view of the radars contributing data (when using -fov and/or -ffov). |
-tmtick tick | set the grid interval for the time clock-dial to tick hours. |
-lst | use local solar time rather than local time. |
-term | plot the terminator. |
-fterm | plot a filled terminator. |
-tmlbl | Label the time clock-dial. |
-lnewdt lnewdt | set the line width to lnewdt. |
-bgcol aarrggbb | set the background color to aarrggbb, specified as the hexadecimal value for the 32-bit alpha,red,green and blue component color. |
-txtcol aarrggbb | set the color of the text to aarrggbb, specified as the hexadecimal value for the 32-bit alpha,red,green and blue component color. |
-grdcol aarrggbb | set the color of the grid to aarrggbb, specified as the hexadecimal value for the 32-bit alpha,red,green and blue component color. |
-igrdcol aarrggbb | set the color of the inverse grid to aarrggbb, specified as the hexadecimal value for the 32-bit alpha,red,green and blue component color. |
-cstcol aarrggbb | set the color of the coastline to aarrggbb, specified as the hexadecimal value for the 32-bit alpha,red,green and blue component color. |
-bndcol aarrggbb | set the color of the state boundaries to aarrggbb, specified as the hexadecimal value for the 32-bit alpha,red,green and blue component color. |
-lndcol aarrggbb | set the color of the land to aarrggbb, specified as the hexadecimal value for the 32-bit alpha,red,green and blue component color. |
-seacol aarrggbb | set the color of the sea to aarrggbb, specified as the hexadecimal value for the 32-bit alpha,red,green and blue component color. |
-tmkcol aarrggbb | set the color of the time clock-dial to aarrggbb, specified as the hexadecimal value for the 32-bit alpha,red,green and blue component color. |
-fovcol aarrggbb | set the color of the field of view outline to aarrggbb, specified as the hexadecimal value for the 32-bit alpha,red,green and blue component color. |
-ffovcol aarrggbb | set the color of the filled field of view to aarrggbb, specified as the hexadecimal value for the 32-bit alpha,red,green and blue component color. |
-vecccol aarrggbb | if a colorkey is not used then set the color of vectors aarrggbb, specified as the hexadecimal value for the 32-bit alpha,red,green and blue component color. |
-trmcol aarrggbb | set the color of the terminator outline to aarrggbb, specified as the hexadecimal value for the 32-bit alpha,red,green and blue component color. |
-ftrmcol aarrggbb | set the color of the filled terminator outline to aarrggbb, specified as the hexadecimal value for the 32-bit alpha,red,green and blue component color. |
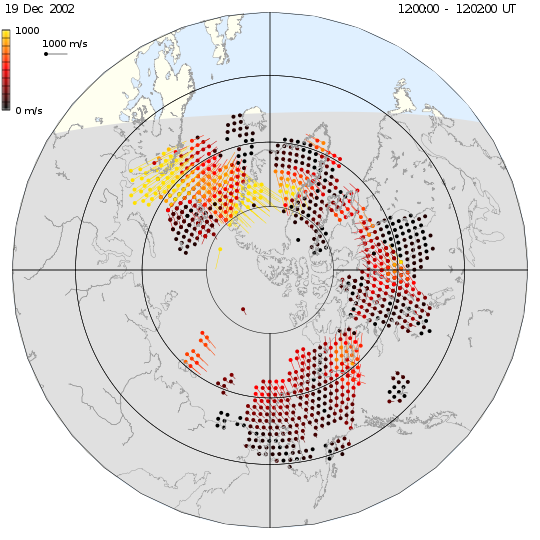
-vkey vkeyname | load the velocity colorkey from the file vkeyname. |
-vkey_path vkey_path | load the velocity colorkey from the custom path vkey_path. |
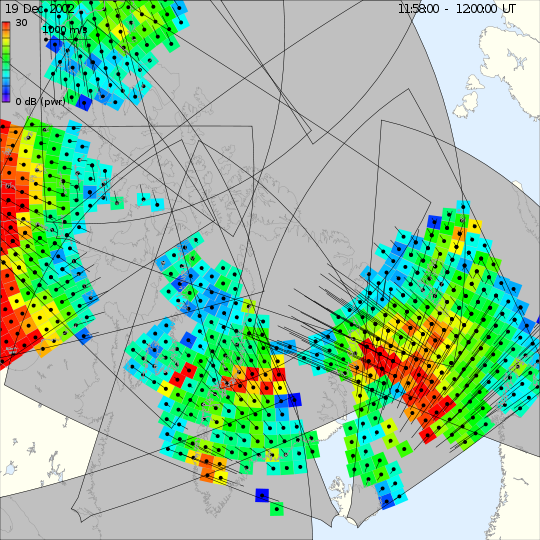
-xkey xkeyname | load the extra colorkey (used to plot power or spectral width) from the file xkeyname. |
-xkey_path xkey_path | load the extra colorkey from the custom path xkey_path. |
-raw | plot raw line of sight velocity vectors. |
-mrg | plot merged two-dimensional vectors. |
-pwr | plot power. |
-swd | plot spectral width. |
-avg | if a cell contains more than one data point, plot the average power or spectral width. |
-max | if a cell contains more than one data point, plot the maximum power or spectral width. |
-min | if a cell contains more than one data point, plot the minimum power or spectral width. |
-vkeyp | plot the color key for the velocity scale. |
-xkeyp | plot the extra color key for the power or spectrral width scale. |
-vecp | plot the example vector. |
-vsf vsf | set the vector scale factor to vsf. |
-vrad vrad | set the radius of the dot a the vector root to vrad. |
-logo | plot the logo and credits. |
-time | plot the time of the plotted data. |
-vmax vmax | set the absolute velocity scale maximum to vmax. |
-pmax pmax | set the power scale maximum to pmax. |
-wmax vmax | set the spectral width scale maximum to wmax. |
-frame | add a frame around the borders of the plot. |
-over | the output plot will be overlaid on another plot, do not paint the background with the bacground color. |
gridname | filename of the grdmap format file to plot. |
inxname | filename of the index file associated with the grdmap format file to plot. |
-stdout | plot a single data record and write the plot to standard output. |
-d yyyymmdd | plot the data on date yyyymmdd (when using -stdout). |
-t hr:mn | plot the data at the time hr:mn (when using -stdout). |
-png | produce a Portable Network Graphics (PNG) image as the output. |
-ps | produce a PostScript plot as the output. |
-xp xoff | set the X offset of the PostScript plot to xoff. |
-yp xoff | set the Y offset of the PostScript plot to yoff. |
-ppm | produce a Portable PixMap (PPM) image as the output. |
-ppmx | produce an extended Portable PixMap (PPMX) image as the output. |
-xml | produce an XML image representation as the output. |
-x | plot the data on an X-terminal. |
-display display | connect to the xterminal named display. |
-xoff xoff | open the window, xoff pixels from the left edge of the screen. |
-yoff yoff | open the window ypad pixels from the top edge of the screen. |
-delay delay | set the delay between frames to delay milliseconds, a value of 0 will pause the frame until a mouse button is pressed. Default: 0 |
-chisham | draw radar fields of view using the Chisham virtual height model. |